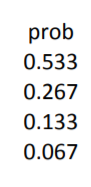
The probabilities shown are directly from Exam P/Bahnemann's basic review chapters. Don't overthink it, just remember an event either happens or does not and there's a probability associated with each of these outcomes for the event.
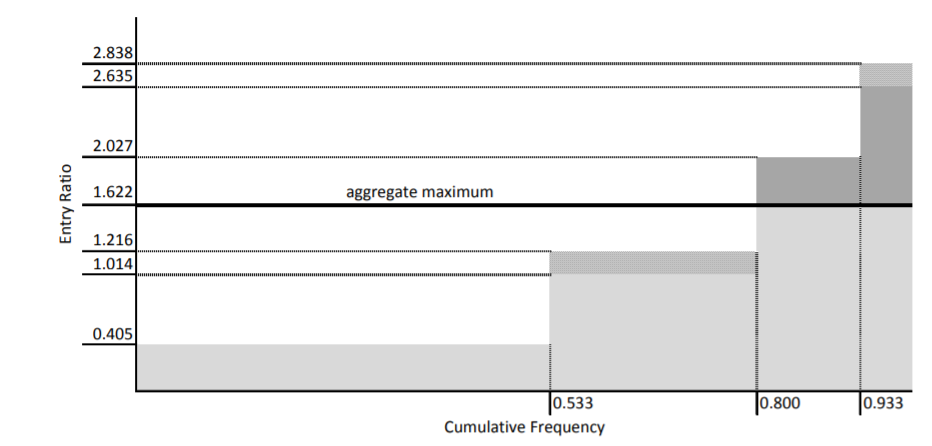
Then start by drawing a diagram of the cumulative frequency (x-axis) and loss dollars (y-axis). Apply the occurrence limit (calculated in part a but can be calculated here) and aggregate limit to each type of loss and label the dollar payout for each type.
Lastly, convert to a Lee diagram by dividing the loss dollars by the expected unlimited loss.
In order to solve part b, we need to be able to solve part a. I thought this was material from Fisher.OtherLSPlans, but is not listed among the BQs. I tried to solve part a, but have no idea how this is done. You mention that the probabilities can be derived from exam P, but I still do not follow. For example, how is 0.533 calculated?
First write out the list of all possible loss scenarios. They are $500,000; $1,500,000; $2,500,000; and $3,500,000. Notice the $500,000 loss is always occurring.
Now assign probabilities. A $1 million large loss occurs every 3 years so has an annual probability of 1/3. To have a $500,000 loss means both the additional $1 million and $2 million scenarios did not occur. The probability of this is (1 - 1/3)*(1 - y) where y corresponds to the $2 million scenario. You've got it from here!
In the top right corner of the Lee Diagram for this question, is it consequential that we state that that portion is excluded due to the per occurrence limit? I never would have thought of it that way. In my mind, since it was an amount above the aggregate limit, I would have just noted it as excluded due to the aggregate limit. Is that an alternative, valid answer?
Yes, stating it the way you do above would likely have cost around 0.25 to 0.5 points on the exam because the CAS says in the examiner's report "clear identification of the impact of the aggregate and occurrence limits".
Assuming you correctly solved part a to get the per-occurrence deductible of $750,000 you need to look at the total unlimited loss and figure out how it is constructed. In the case when it's $3,500,000 this is the base $500,000 plus another $2,000,000 of low severity losses plus another $1,000,000 from a single large loss. It's implicit the additional low severity losses are all below the per-occurrence deductible, so base plus these are capped using the aggregate limit. However, the single large loss is above the $750k per-occurrence deductible, so is first capped by the per-occurrence limit and then the aggregate limit kicks in when it's a 1-in-15 year scenario.
Why is it that we show the portion that is excluded for the 3.5 million dollar loss due to the occurrence deductible but not the 2.5 million dollar loss. Is a portion of 2.5 million loss also excluded due to the deductible of 750,000? Also how was the Entry Ratio line calculated to show the portion of losses excluded by the per occurrence limit. They seem to be consistently 250,000 dollars less?
We're told the low severity loss is $500,000 and in part a we worked out the appropriate deductible is $750,000. The Lee diagram shows the deductible losses as the retained loss (light grey area). For the 2.5 million loss we're told it consists solely of low severity losses (5x 500k) so there is no portion excluded by the per-occurrence deductible of 750k. Only the aggregate deductible excludes loss for the 2.5 million event.
In contrast, the 3.5 million and 1.5 million events include a large loss of 1million. That loss is capped first by the per-occurrence deductible at 750k, i.e. the per-occurrence deductible excludes 250k of loss in each event.

Comments
The probabilities shown are directly from Exam P/Bahnemann's basic review chapters. Don't overthink it, just remember an event either happens or does not and there's a probability associated with each of these outcomes for the event.
Then start by drawing a diagram of the cumulative frequency (x-axis) and loss dollars (y-axis). Apply the occurrence limit (calculated in part a but can be calculated here) and aggregate limit to each type of loss and label the dollar payout for each type.
Lastly, convert to a Lee diagram by dividing the loss dollars by the expected unlimited loss.
In order to solve part b, we need to be able to solve part a. I thought this was material from Fisher.OtherLSPlans, but is not listed among the BQs. I tried to solve part a, but have no idea how this is done. You mention that the probabilities can be derived from exam P, but I still do not follow. For example, how is 0.533 calculated?
First write out the list of all possible loss scenarios. They are $500,000; $1,500,000; $2,500,000; and $3,500,000. Notice the $500,000 loss is always occurring.
Now assign probabilities. A $1 million large loss occurs every 3 years so has an annual probability of 1/3. To have a $500,000 loss means both the additional $1 million and $2 million scenarios did not occur. The probability of this is (1 - 1/3)*(1 - y) where y corresponds to the $2 million scenario. You've got it from here!
I would never have thought of this during an exam. Thanks, I understand now.
In the top right corner of the Lee Diagram for this question, is it consequential that we state that that portion is excluded due to the per occurrence limit? I never would have thought of it that way. In my mind, since it was an amount above the aggregate limit, I would have just noted it as excluded due to the aggregate limit. Is that an alternative, valid answer?
Yes, stating it the way you do above would likely have cost around 0.25 to 0.5 points on the exam because the CAS says in the examiner's report "clear identification of the impact of the aggregate and occurrence limits".
Assuming you correctly solved part a to get the per-occurrence deductible of $750,000 you need to look at the total unlimited loss and figure out how it is constructed. In the case when it's $3,500,000 this is the base $500,000 plus another $2,000,000 of low severity losses plus another $1,000,000 from a single large loss. It's implicit the additional low severity losses are all below the per-occurrence deductible, so base plus these are capped using the aggregate limit. However, the single large loss is above the $750k per-occurrence deductible, so is first capped by the per-occurrence limit and then the aggregate limit kicks in when it's a 1-in-15 year scenario.
Why is it that we show the portion that is excluded for the 3.5 million dollar loss due to the occurrence deductible but not the 2.5 million dollar loss. Is a portion of 2.5 million loss also excluded due to the deductible of 750,000? Also how was the Entry Ratio line calculated to show the portion of losses excluded by the per occurrence limit. They seem to be consistently 250,000 dollars less?
We're told the low severity loss is $500,000 and in part a we worked out the appropriate deductible is $750,000. The Lee diagram shows the deductible losses as the retained loss (light grey area). For the 2.5 million loss we're told it consists solely of low severity losses (5x 500k) so there is no portion excluded by the per-occurrence deductible of 750k. Only the aggregate deductible excludes loss for the 2.5 million event.
In contrast, the 3.5 million and 1.5 million events include a large loss of 1million. That loss is capped first by the per-occurrence deductible at 750k, i.e. the per-occurrence deductible excludes 250k of loss in each event.