Sample variance from moments

Does excel not use the formula above, or would the formula be wrong if we are given manual prems? (2017_2-Fall)_(11) uses the above formula so I am guessing it's the former.
Does excel not use the formula above, or would the formula be wrong if we are given manual prems? (2017_2-Fall)_(11) uses the above formula so I am guessing it's the former.
Comments
Excel uses the sample variance formula that you show but with one crucial difference. I strongly encourage you to explore the following within Excel.
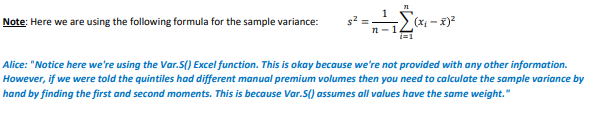
When you use Var.S(range) Excel applies the above formula to the range, treating each cell in the range as an x_i value. Critically, this means it estimates the average x value via the arithmetic mean of the range. Whereas to solve this problem correctly, we use a weighted average of the x_i where the weights are the manual premiums.
If the manual premiums for the quintiles are all similar then the magnitude of the error is pretty small. However, if there's some skewness to the manual premiums then the error can get large.
Ultimately, to be safe, if you're not given manual premiums you can use Var.S() but if you have manual premiums then you're best off calculating the total row average and performing the calculation by hand.
Thanks! One follow up question. Is there a handy reference for which excel functions work as expected, and which ones don't, on the exam environment? This will be my first time on this environment.
The CAS/Pearson provide a list of Excel functions (download using the menu on the right here: https://home.pearsonvue.com/cas) but no guidance as to whether they're appropriate to use for any particular problem.
We're currently working on some tips for the CBT environment based on what we've experienced using the Pearson demo files and through feedback received within the bounds of the CAS exam policy. Stay tuned!
Thanks!
On this same question (2017 #11), would the fact that the standard LR dispersion is equal between the two plans be a reason not to implement it since the proposed plan isn't adjusting much more than the current plan? The 2017 Exam Report only mentions that there is a slight improvement to the manual LR and aggregate 3% cost to standard LRs, but didn't mention the standard LR dispersion.
I would say no for two reasons. Firstly, when we look at the standard loss ratios we're concerned with how well the plan corrects for the differences between risks that it has identified. That is, we're interested whether there are directional trends in the standard loss ratios so we know if we're under or over correcting based on the observed data. Two plans could have the same standard loss ratio dispersion but if one has a (small) upward trend in the standard loss ratios while the other is essentially random then the random one performs better.
Secondly, in this question I calculate the standard LR dispersion for the current plan as 71% - 64% = 7% while for the proposed plan it's 75% - 64% = 11%, so the dispersion isn't equal between them.
In our opinion sample 2 is a much better answer than sample 1 because the question asks you to respond in light of management's concerns about customer retention, premium growth and loss ratio deterioration.