We're not given enough information about the risk to directly calculate the converted insurance charge so you have to use the information in the chart to estimate it.
phi_(r_G) is the ratio of expected excess losses to expected losses at entry ratio r. Use the chart to calculate the average loss ratio, which is 0.6. This is the expected loss ratio. Note this conveniently matches up with the expected loss ratio for our risk, so this is favorable evidence for estimating the insurance charge and savings using the data in the chart.
The r value to use in the calculation of the insurance charge corresponds to the maximum premium. r = loss ratio at maximum premium / expected loss ratio for the policy being priced.
Since the chart given is in terms of loss ratio rather than entry ratio, we can in fact ignore the denominator and work directly with the loss ratios to calculate the insurance charge. This only works because the chart and policy in question have the same expected loss ratio.
Now calculate the expected excess loss using the chart by adding up the pieces of the bars that exceed the 60% expected loss ratio for the chart but are limited by the 80% loss ratio at maximum premium. Divide this by the expected loss ratio to get phi_(r_G).
Now it's your turn to apply similar logic to come up with psi_(r_H).
"Now calculate the expected excess loss using the chart by adding up the pieces of the bars that exceed the 60% expected loss ratio for the chart but are limited by the 80% loss ratio at maximum premium"
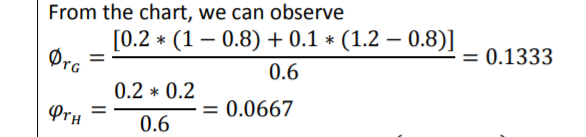
To me, this is
Which yields 0.1, so phi(r_g) = 0.1 / 0.6 = 0.16667.
Sorry, a poor attempt on our part. Phi_(r_G) is the Table M charge for losses which exceed the maximum premium (we're given a maximum premium rather than a maximum loss but the idea is the same). Since the maximum premium loss ratio is 80% we need the portion of the loss which lies above the 80% loss ratio. Lastly, remember phi_(r_G) is a ratio to the expected loss, so we need to divide by the expected loss ratio for the chart, 60%.
Similarly, psi(r_H) is the Table M savings which corresponds to losses below those associated with the minimum premium. Note 20% of the risks have a loss ratio less than that associated with the minimum premium.

Comments
We're not given enough information about the risk to directly calculate the converted insurance charge so you have to use the information in the chart to estimate it.
phi_(r_G) is the ratio of expected excess losses to expected losses at entry ratio r. Use the chart to calculate the average loss ratio, which is 0.6. This is the expected loss ratio. Note this conveniently matches up with the expected loss ratio for our risk, so this is favorable evidence for estimating the insurance charge and savings using the data in the chart.
The r value to use in the calculation of the insurance charge corresponds to the maximum premium. r = loss ratio at maximum premium / expected loss ratio for the policy being priced.
Since the chart given is in terms of loss ratio rather than entry ratio, we can in fact ignore the denominator and work directly with the loss ratios to calculate the insurance charge. This only works because the chart and policy in question have the same expected loss ratio.
Now calculate the expected excess loss using the chart by adding up the pieces of the bars that exceed the 60% expected loss ratio for the chart but are limited by the 80% loss ratio at maximum premium. Divide this by the expected loss ratio to get phi_(r_G).
Now it's your turn to apply similar logic to come up with psi_(r_H).
Still not understanding:
"Now calculate the expected excess loss using the chart by adding up the pieces of the bars that exceed the 60% expected loss ratio for the chart but are limited by the 80% loss ratio at maximum premium"
To me, this is
Which yields 0.1, so phi(r_g) = 0.1 / 0.6 = 0.16667.
Sorry, a poor attempt on our part. Phi_(r_G) is the Table M charge for losses which exceed the maximum premium (we're given a maximum premium rather than a maximum loss but the idea is the same). Since the maximum premium loss ratio is 80% we need the portion of the loss which lies above the 80% loss ratio. Lastly, remember phi_(r_G) is a ratio to the expected loss, so we need to divide by the expected loss ratio for the chart, 60%.
Similarly, psi(r_H) is the Table M savings which corresponds to losses below those associated with the minimum premium. Note 20% of the risks have a loss ratio less than that associated with the minimum premium.
This helps immensely. Thanks!